Medicare Advantage Fact Sheet
May 01, 2014
Since the 1970s, Medicare beneficiaries have had the option to receive their Medicare benefits through private health plans, mainly health maintenance organizations (HMOs), as an alternative to the federally administered traditional Medicare program. The Balanced Budget Act (BBA) of 1997 named Medicare’s managed care program “Medicare+Choice” and the Medicare Modernization Act (MMA) of 2003 renamed it “Medicare Advantage.” Medicare payments to plans are projected to total $156 billion in 2014, accounting for 30% of total Medicare spending (CBO April 2014 Medicare Baseline).
Over the past decades, Medicare payment policy for plans has shifted from one that produced savings to one that focused more on expanding access to private plans and providing extra benefits to Medicare private plan enrollees. These policy changes resulted in Medicare paying private plans more per enrollee than the cost of care for beneficiaries in traditional Medicare, on average (MedPAC 2010). The Affordable Care Act (ACA) of 2010 produced another shift in payment policy by reducing federal payments to Medicare Advantage plans over time, bringing them closer to the average costs of care under the traditional Medicare program. It also provided for new bonus payments to plans based on quality ratings, beginning in 2012, and required plans beginning in 2014 to maintain a medical loss ratio of at least 85%, restricting the share of premiums that Medicare Advantage plans can use for administrative expenses and profits.
Medicare Advantage Enrollment
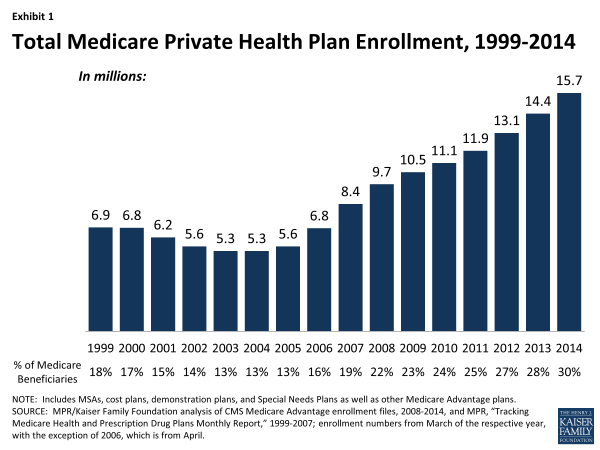
In 2014, the majority of the 54 million people on Medicare are in the traditional Medicare program, with 30% enrolled in a Medicare Advantage plan (Exhibit 1). Since 2004, the number of beneficiaries enrolled in private plans has almost tripled from 5.3 million to 15.7 million in 2014.
Exhibit 1. Total Medicare Private Health Plan Enrollment, 1999-2014
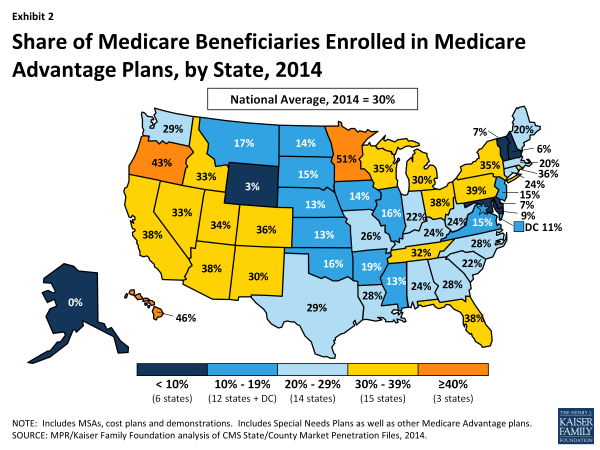
Enrollment in private plans varies by state, ranging from 51% in Minnesota to less than 1% in Alaska, and vary within states, by county (Exhibit 2).
Exhibit 2. Share of Medicare Beneficiaries Enrolled in Medicare Advantage Plans, by State, 2014
Medicare Advantage Plan Types
Medicare contracts with insurers to offer the following different types of health plans:
Local HMOs and PPOs contract with provider networks to deliver Medicare benefits. HMOs account for the majority (64%) of total Medicare Advantage enrollment in 2014; local PPOs, account for 23% of all Medicare Advantage enrollees (Exhibit 3).
Exhibit 3. Distribution of Enrollment in Medicare Advantage Plans, by Plan Type, 2014
Regional PPOs were established to provide rural beneficiaries greater access to Medicare Advantage plans, and cover entire statewide or multi-state regions. Regional PPOs account for 8% of all Medicare Advantage enrollees in 2014.
Private Fee-for-Service plans (PFFS), as authorized in 1997, were not required to establish networks, but since 2011, have generally been required to do so. PFFS enrollment increased ten-fold from 0.2 million enrollees in 2005 to 2.2 million 2009, but has since declined to 0.3 million enrollees in 2014, or 2% of all Medicare Advantage enrollees.
Other types of private plans (e.g., cost plans, HCPP, PACE plans, medical savings accounts, demonstrations and pilots) account for 3% of private plan enrollment. In a small number of states (e.g., MN), a large percentage of private plan enrollment is in cost plans, which are paid based on the “reasonable cost” of providing services and, unlike Medicare Advantage plans, do not assume financial risk if federal payments do not cover their costs.
Special Needs Plans (SNPs), typically HMOs, are restricted to beneficiaries who: (1) are dually eligible for Medicare and Medicaid; (2) live in long-term care institutions (or would otherwise require an institutional level of care); or (3) have certain chronic conditions. Since 2006, the number of SNP enrollees has increased from 0.5 million to 1.9 million enrollees in 2014; enrollment in SNPs for dual eligibles accounts for 82% of total enrollment in SNPs.
Payments To Medicare Private Plans
Medicare pays Medicare Advantage plans a capitated (per enrollee) amount to provide all Part A and B benefits. In addition, Medicare makes a separate payment to plans for providing prescription drug benefits under Medicare Part D. Prior to the BBA of 1997, Medicare paid plans 95% of average traditional Medicare costs in each county because HMOs were thought to be able to provide care more efficiently than could be provided in traditional Medicare. These payments were not adjusted for health status, and HMOs typically enrolled beneficiaries who were healthier than average.
Beginning in the late 1990s, Congress revised the payment formula to attract more plans throughout the country, particularly in rural and certain urban areas. The BBA of 1997 established a payment floor, applicable almost exclusively to rural counties. The Benefits Improvement and Protection Act (BIPA) of 2000 created payment floors for urban areas and increased the floor for rural areas. The MMA of 2003 increased payments across all areas.
Since 2006, Medicare has paid plans under a bidding process. Plans submit “bids” based on estimated costs per enrollee for services covered under Medicare Parts A and B; all bids that meet the necessary requirements are accepted. The bids are compared to benchmark amounts that are set by a formula established in statute and vary by county (or region in the case of regional PPOs). The benchmarks are the maximum amount Medicare will pay a plan in a given area. If a plan’s bid is higher than the benchmark, enrollees pay the difference between the benchmark and the bid in the form of a monthly premium, in addition to the Medicare Part B premium. If the bid is lower than the benchmark, the plan and Medicare split the difference between the bid and the benchmark; the plan’s share is known as a “rebate,” which must be used to provide supplemental benefits to enrollees. Medicare payments to plans are then adjusted based on enrollees’ risk profiles.
The ACA of 2010 revised the methodology for paying plans and reduced the benchmarks. For 2011, benchmarks were frozen at 2010 levels. Reductions in benchmarks will be phased-in over 2 to 6 years between 2012 and 2016. By 2017, when the new benchmarks are fully phased-in, the benchmarks will range from 95% of traditional Medicare costs in the top quartile of counties with relatively high per capita Medicare costs (e.g., Miami-Dade), to 115% of traditional Medicare costs in the bottom quartile of counties with relatively low Medicare costs (e.g., Boise).
The ACA specified that plans with higher quality ratings would receive bonus payments added to their benchmarks, beginning in 2012. The ACA also reduced rebates for all plans, but allowed plans with higher quality ratings to keep a larger share of the rebate than plans with lower quality ratings. A CMS demonstration was implemented in 2012 that superseded bonuses specified by the ACA, raised the size of the bonus payments, and increased the number of plans that would receive bonus payments, providing an additional $8 billion in bonuses between 2012 and 2014.
Supplemental And Prescription Drug Benefits
Medicare Advantage plans are paid to provide all Medicare benefits. In addition, if they receive rebates, they are required to use these payments to provide additional benefits, such as eyeglasses, or reduce premiums or cost sharing for covered benefits. Medicare Advantage plans are generally required to offer at least one plan that covers the Part D drug benefit. In 2014, 83% of Medicare Advantage plans offer prescription drug coverage, and 50% provide some coverage in the gap. All Part D enrollees receive a 50% discount on brand-name drugs in the gap, beginning in 2011. Since 2011, all plans have been required to limit beneficiaries’ out-of-pocket spending to no more than $6,700.
Medicare Advantage Premiums
The average premium for enrollees of Medicare Advantage Prescription Drug plans will be $35 per month in 2014, similar to premiums in 2013 and 2012. Premiums were lower for HMOs and regional PPOs than for local PPOs and PFFS plans; we do not know whether cost sharing for individual services has changed and thus do not know to what extent enrollees’ out-of-pocket expenses have changed (Exhibit 4).
Exhibit 4. Weighted Average Monthly Premiums for Medicare Advantage Prescription Drug Plans, Total and by Plan Type, 2010-2014
Future Issues
Historically, Congress has enacted a number of changes that affect the role of private plans under Medicare, including adding new types of plans to the program, increasing or decreasing Medicare payments to plans, tightening the rules governing the marketing of the plans, and even changing the name of the program (from “Medicare+Choice” to “Medicare Advantage”). The Affordable Care Act of 2010 made a number of changes to the Medicare Advantage program, driven largely by concerns about the payment system and its effect on Medicare spending.
In 2014, Medicare Advantage markets and plans will look much as they did in 2013, in terms of the number of plans available to beneficiaries. Over the longer term, companies offering Medicare Advantage plans may respond to payment changes in several different ways, depending on the circumstances of the company, the location of their plans, their historical commitment to the Medicare market, their ability to leverage efficiencies in the delivery of care to enrollees, and possibly their quality ratings and bonus payments. Decisions made by these firms could have important implications for beneficiaries with respect to their choice of plans, out-of-pocket costs, and access to providers.
Achieving a reasonable balance among multiple goals for the Medicare program—including keeping Medicare fiscally strong, setting adequate payments to private plans, and meeting beneficiaries’ health care needs—will continue to be a critical issue for policymakers in the future.


